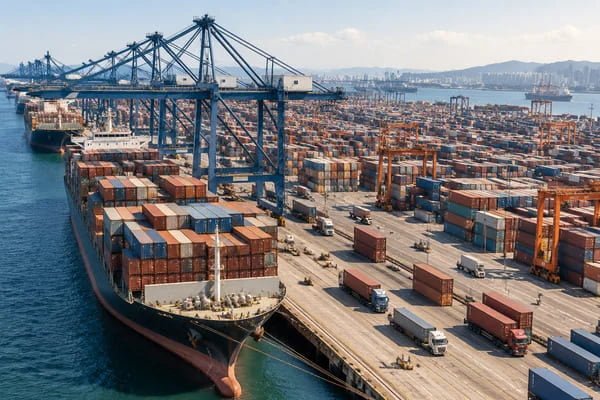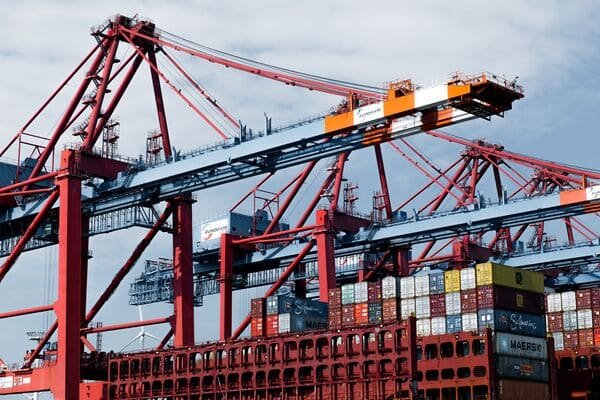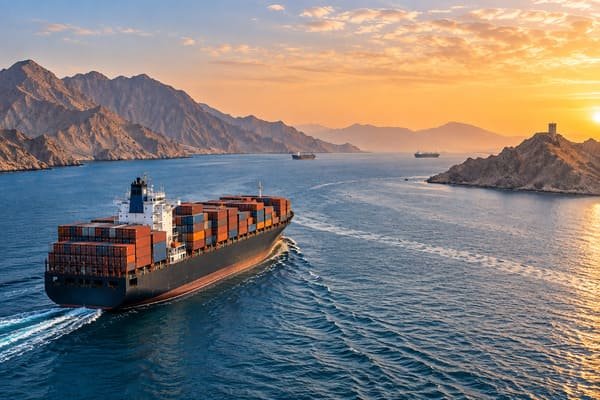

Port congestion at Shanghai and Ningbo is once again putting pressure on global container shipping.
Following a series of typhoons and weather-related operational interruptions, vessels have arrived in concentrated waves at two of the world’s busiest container ports1. The resulting vessel bunching2, terminal backlogs and schedule disruption have reportedly pushed berthing delays to around 10 days in some cases.
For importers and exporters, this is more than a local port issue. Shanghai and Ningbo are critical gateways for manufacturing and international trade3, connecting Chinese exporters with markets across North America, Europe, Southeast Asia and beyond. Delays at these ports can quickly spread through global carrier networks.
What Is Causing the Congestion?
The immediate trigger has been severe weather.
Typhoons affecting China’s eastern coast forced ports to suspend or restrict operations4 for safety reasons. Although terminals can resume work relatively quickly after a storm passes, the disruption does not end when a port reopens.
During a closure, vessels continue moving toward the region while scheduled port calls accumulate. When operations restart, terminals must handle both the existing queue and newly arriving ships.
This creates vessel bunching, where several ships arrive within a compressed period and compete for available berths, cranes, pilots and tug services.
Several operational pressures can then reinforce one another:
- Ships wait longer for a berth.
- Containers remain in terminals for extended periods.
- Yard density increases.
- Truck and barge connections become less predictable.
- Empty-container positioning becomes more difficult.
- Delayed vessels arrive late at subsequent ports.
A short weather disruption can therefore affect shipping schedules for several weeks5.
Effective Capacity Is Tightening
One of the most important consequences of port congestion is the reduction in effective shipping capacity.
The global containership fleet may not physically shrink, but ships waiting outside ports are temporarily unavailable for productive voyages6. They cannot complete their rotations on schedule, collect their next cargoes or reposition equipment as planned.
Recent market estimates have placed the amount of containership capacity waiting to berth globally at approximately 3.9 million to 4.3 million TEU7. North Asia reportedly accounts for roughly half of the current congestion8.
In absolute terms, delayed capacity has approached or exceeded levels recorded during the pandemic-era disruption9. However, the global fleet is now considerably larger, so the share of total capacity affected remains below the pandemic peak.
This distinction is important. The market is not necessarily returning to the same system-wide breakdown experienced during COVID-19, but the congestion is already significant enough to reduce schedule reliability and tighten available capacity on key routes.
For shippers, effective capacity often matters more than nominal fleet size. A vessel only contributes useful capacity when it is available in the right place and operating close to schedule.
How Could Freight Rates Be Affected?
Congestion tends to support freight rates by absorbing vessels and disrupting equipment flows10.
The effect may be particularly noticeable on transpacific services, where demand and operational pressure have kept the market relatively firm. When carriers have fewer ships available to maintain weekly departures, they may reduce capacity, cancel sailings or adjust port rotations.
Cargo owners may consequently face:
- Higher spot freight rates
- Reduced space availability
- Rolled bookings
- Additional peak-season or congestion surcharges
- Higher equipment repositioning costs
- Increased demurrage, detention or storage exposure
The impact will not necessarily be equal across all trade lanes. Demand on Asia–Europe services may remain softer than on transpacific routes, limiting the ability of carriers to increase rates uniformly.
The direction of freight rates will therefore depend on the interaction between port congestion, cargo demand and the amount of capacity carriers deploy on each route.
The Risk of Skipped Port Calls
As delays increase, carriers may omit scheduled port calls to recover their vessel rotations11.
Skipping a port can help a ship return closer to schedule, but it creates additional complications for cargo owners. Export containers may be rolled to another sailing, while import containers could be discharged at an alternative port and moved through a different connection.
Transshipment cargo is especially vulnerable. A late vessel may miss its connecting service, leaving containers at a hub until space becomes available on a later departure.
Shippers should therefore monitor operational changes rather than relying only on the original booking confirmation. Published schedules can become outdated quickly during periods of congestion.
Potential Knock-On Effects Across Global Networks
A ship delayed in Shanghai or Ningbo does not recover the lost time immediately after departure.
It may reach the next Asian, European or North American port outside its planned berthing window. If the terminal cannot accommodate the late arrival, the vessel may wait again—extending the disruption further through the rotation.
This can produce several downstream effects:
- Congestion at transshipment hubs
- Missed feeder connections
- Irregular vessel arrivals at destination ports
- Sudden peaks in terminal and inland transportation demand
- Shortages of empty containers in export markets
- Longer and less predictable door-to-door transit times
The severity of these effects will depend on how quickly Shanghai and Ningbo clear their backlogs and whether further weather interruptions occur.
What Should Shippers Do Now?
Companies with cargo moving through Shanghai, Ningbo or connected transshipment hubs should consider several practical measures.
1. Confirm Operational Dates
Check actual terminal cut-off, estimated berthing and departure times with the carrier or logistics provider. Do not rely solely on the original sailing schedule.
2. Book Earlier
Secure space earlier than usual, especially for time-sensitive transpacific shipments. Early booking cannot eliminate disruption, but it provides more time to manage alternative options.
3. Allow Additional Lead Time
Build a realistic buffer into procurement, production and delivery plans. Port-to-port transit estimates may not reflect waiting time before loading or delays at connecting hubs.
4. Review Alternative Gateways
Where commercially practical, evaluate alternative Chinese ports or different service combinations.
However, changing ports should be based on confirmed capacity and inland transportation costs rather than congestion headlines alone.
5. Monitor Transshipment Cargo Closely
Identify shipments with tight connections and ask whether the carrier has confirmed onward space. Missing a connection may add several days—or longer—to the final delivery time.
6. Review Free-Time Conditions
Longer terminal dwell times can increase exposure to storage, demurrage and detention charges. Confirm free-time arrangements and clarify how carrier-caused delays will be handled.
7. Prioritize Critical Shipments
Not every container requires the same response. Identify cargo that could stop production, miss a sales window or create contractual penalties, and allocate premium transportation options selectively.
Outlook
The immediate outlook will depend on terminal productivity, vessel arrival patterns and weather conditions along China’s eastern coast.
Even without further port closures, clearing a large backlog takes time. Schedule reliability is likely to remain under pressure as delayed vessels move through their remaining port rotations.
The situation should not automatically be treated as a return to pandemic-era disruption. Nevertheless, it is a timely reminder that nominal fleet growth does not guarantee immediately available capacity.
When weather interruptions, port congestion, vessel bunching and equipment imbalances occur simultaneously, supply chains can tighten quickly.
For cargo owners, the most effective response is not panic—it is visibility. Companies that monitor actual vessel movements, maintain realistic inventory buffers and prepare routing alternatives will be better positioned to manage the disruption.
Sources: Shanghai Shipping Exchange, Linerlytica market estimates, Panama Canal Authority, The Loadstar and The Maritime Executive. Operational conditions can change rapidly; shippers should confirm current schedules directly with their carrier or logistics provider.
---"List of busiest container ports", https://en.wikipedia.org/wiki/List_of_busiest_container_ports. A global container-port ranking by annual TEU throughput identifies Shanghai and Ningbo-Zhoushan among the world’s highest-volume container ports, supporting their characterization as major global gateways. Evidence role: statistic; source type: institution. Supports: Shanghai and Ningbo are two of the world’s busiest container ports.. ↩
"An analysis of port congestion alleviation strategy based on ...", https://pmc.ncbi.nlm.nih.gov/articles/PMC9417887/. Research on port-call reliability and queueing in container terminals describes vessel bunching as the clustered arrival of ships after schedule disruption, supporting the mechanism by which weather closures can create berth competition. Evidence role: mechanism; source type: paper. Supports: Vessel bunching occurs when several ships arrive within a compressed period and compete for limited port resources.. ↩
"Liner Shipping Connectivity Index - World Bank Open Data", https://data360.worldbank.org/en/dataset/UNCTAD_LSC. Port authority statistics and trade-infrastructure profiles showing high container throughput and extensive international liner connections support the description of Shanghai and Ningbo as critical gateways for Chinese manufacturing exports; such sources establish gateway significance rather than proving the impact of any single disruption. Evidence role: general_support; source type: institution. Supports: Shanghai and Ningbo are critical gateways for manufacturing and international trade.. Scope note: Contextual support for structural importance, not direct evidence of the present congestion event. ↩
"Shanghai port operations suspended due to Typhoon Shangdu from ...", https://www.facebook.com/fslglobalpvtltd/posts/shanghai-port-operations-updatedue-to-the-impact-of-typhoon-no-18-shangdu-empty-/1105152888742291/. Official maritime-safety, meteorological, or port notices reporting typhoon-related closures, navigation restrictions, or terminal suspensions along China’s eastern coast would support the claim that severe weather interrupted port operations. Evidence role: case_reference; source type: government. Supports: Typhoons affecting China’s eastern coast forced ports to suspend or restrict operations for safety reasons.. Scope note: The evidence should be tied to the specific storm period discussed; general typhoon procedures would only provide contextual support. ↩
"Research on comprehensive recovery of liner schedule and container ...", https://pmc.ncbi.nlm.nih.gov/articles/PMC9351600/. Studies of port disruption propagation and liner-schedule recovery show that short interruptions can generate network delays beyond the initial closure period, supporting the claim that schedule effects may persist for weeks; the duration depends on service rotation design and available recovery buffers. Evidence role: mechanism; source type: paper. Supports: A short weather disruption can affect shipping schedules for several weeks.. Scope note: Provides general mechanism and precedent rather than a forecast for this specific Shanghai-Ningbo episode. ↩
"Performance of Maritime Logistics - OECD", https://www.oecd.org/en/publications/performance-of-maritime-logistics_8e06fcd1-en.html. Maritime-transport analyses by institutions such as UNCTAD explain that port waiting time reduces the effective supply of vessel capacity because ships delayed at anchorage cannot perform scheduled voyages, supporting the effective-capacity mechanism. Evidence role: mechanism; source type: institution. Supports: Ships waiting outside ports are temporarily unavailable for productive voyages, reducing effective shipping capacity.. ↩
"Port Congestion Sets New Record at 4.3M TEU in ...", https://maritime-executive.com/article/port-congestion-sets-new-record-at-4-3m-teu-in-stranded-volume. A dated container-shipping market estimate reporting global containership capacity waiting to berth in the range of 3.9–4.3 million TEU would substantiate the magnitude of delayed capacity; market-intelligence estimates may differ by methodology and cutoff date. Evidence role: statistic; source type: research. Supports: Recent market estimates place global containership capacity waiting to berth at approximately 3.9 million to 4.3 million TEU.. Scope note: The figure is an estimate and should be presented with its source date and methodology caveat where available. ↩
"Congested Chinese Ports Cause Supply Chain Operation Issues", https://supplychaindigital.com/news/congested-chinese-ports-cause-supply-chain-operation-issues. A regional port-congestion breakdown from a shipping-market dataset showing North Asia’s share of capacity waiting to berth would support the claim that the region accounts for about half of current congestion; the estimate is sensitive to how congestion and regional boundaries are defined. Evidence role: statistic; source type: research. Supports: North Asia accounts for roughly half of the current global port congestion.. Scope note: Time-sensitive market estimate; regional shares may shift quickly with vessel arrivals and weather conditions. ↩
"big full containerships and their arrival to south American ports", https://pmc.ncbi.nlm.nih.gov/articles/PMC7936239/. Historical port-congestion datasets comparing current delayed containership capacity with 2020–2022 levels would support the claim that absolute delayed capacity has approached or exceeded pandemic-era readings; this comparison should distinguish absolute TEU from the percentage of total fleet capacity affected. Evidence role: historical_context; source type: research. Supports: In absolute terms, delayed capacity has approached or exceeded levels recorded during the pandemic-era disruption.. Scope note: The comparison depends on the metric used and may not imply equivalent system-wide disruption. ↩
"An analysis of port congestion alleviation strategy based on ...", https://pmc.ncbi.nlm.nih.gov/articles/PMC9417887/. Empirical studies of container freight-rate determinants identify port congestion, vessel delays, and container imbalances as factors that can restrict effective supply and place upward pressure on rates, supporting the stated relationship in general terms. Evidence role: expert_consensus; source type: paper. Supports: Congestion tends to support freight rates by absorbing vessels and disrupting equipment flows.. Scope note: General support for rate mechanisms; it does not prove the direction or size of rate changes in the current episode. ↩
"Research on comprehensive recovery of liner schedule and ...", https://pmc.ncbi.nlm.nih.gov/articles/PMC9351600/. Maritime-operations research and liner-schedule recovery literature describe port omission as a recovery action used to restore service schedules after delays, supporting the claim that carriers may skip calls during congestion. Evidence role: mechanism; source type: paper. Supports: Carriers may omit scheduled port calls to recover their vessel rotations when delays increase.. ↩